|
Hudson River Water Quality Report: Two sampling patrols: June 27 - July 2 and July 14 - July 19, 2011 Highlights You’ll remember that our May survey took place during a really rainy week and water quality was terrible. June had more typical rainfall and more typical sewage impacts. July was a dream patrol, the opposite of May. We sampled during a prolonged period of dry weather and water quality was much improved, we almost saw the entire system test “Acceptable” except for a nasty unpermitted discharge in the Capitol District. The July survey shows us what we could have if we eliminated sewage discharges to our waterways. These first three months of 2011 show how incredibly variable the degree of sewage contamination is in the Hudson Estuary. Of 74 sampling locations: May: 59 samples (80%) were Unacceptable June: 13 samples (17.5%) were Unacceptable July: 6 samples (8%) were Unacceptable
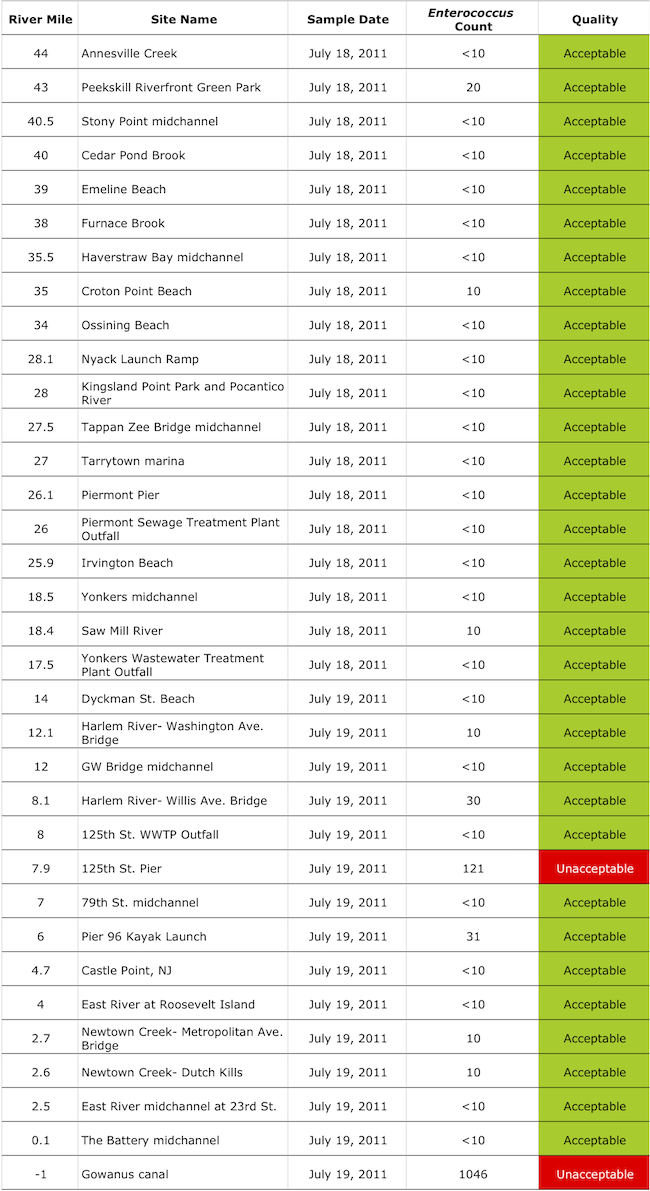
June Observations NY
Harbor (day
1): When we started the patrol it had not rained for 3.5
days. So we were not surprised to see that all sampling locations
around NY Harbor were “Acceptable,” even the Gowanus. It was a little
surprising that the outfall at the 125th Street (“North River”) sewage
treatment plant was the only “Unacceptable” site. Beacon to Rondout
Creek/Kingston (day 4):
The last rain was 0.5” two nights prior. All sample sites were
“Acceptable” except for two of the tributaries. At the mouth of
Wappingers Creek, Entero counts were slightly elevated. At Rondout Creek
all sample sites, including the one at the public beach outside the
mouth of the Rondout, were “Unacceptable.” The beach was open and in
use. Note that as we sampled away from the Hudson (up the Rondout,) the
Entero counts got higher, with the max for the day of 345 Enterococcus
per 100/ml at Eddyville, just east of the dam. It takes very little rain
to see sewage impacts on some locations especially at some
tributaries. It’s worth looking at site-by-site sampling results/history
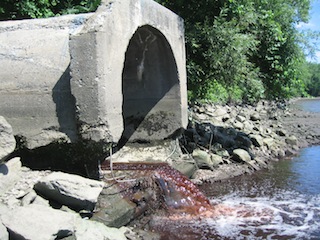
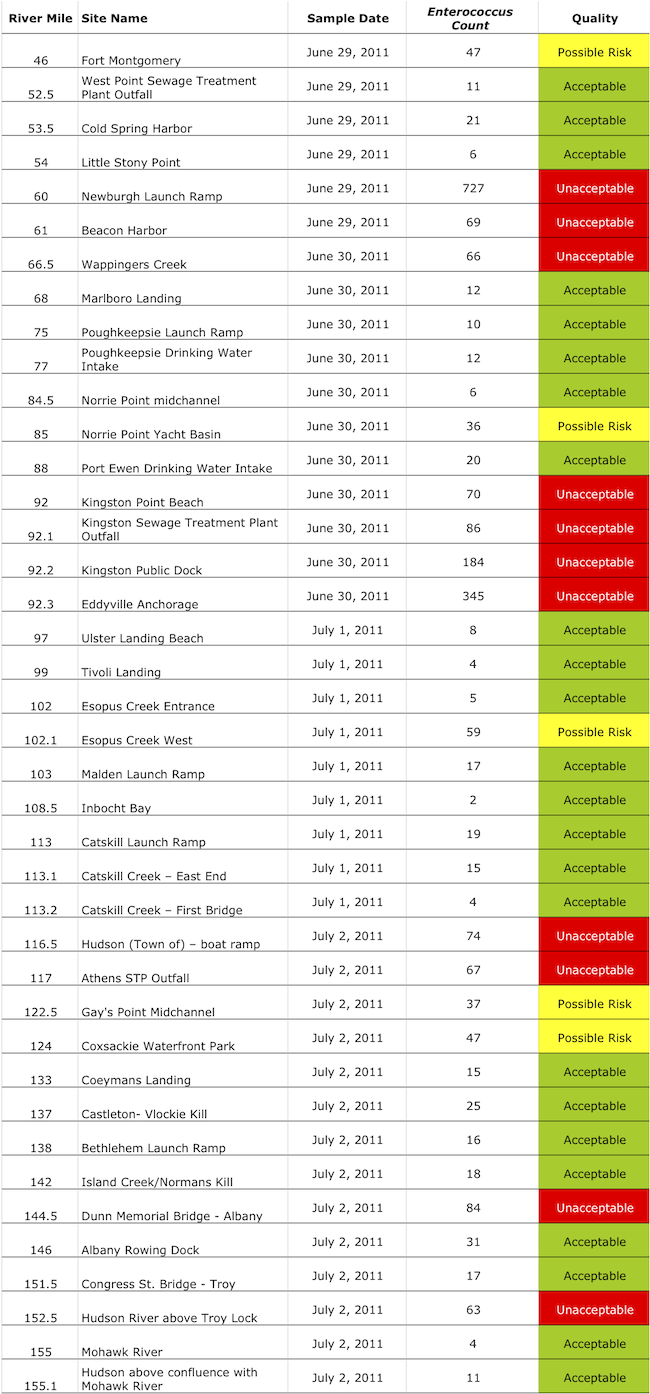
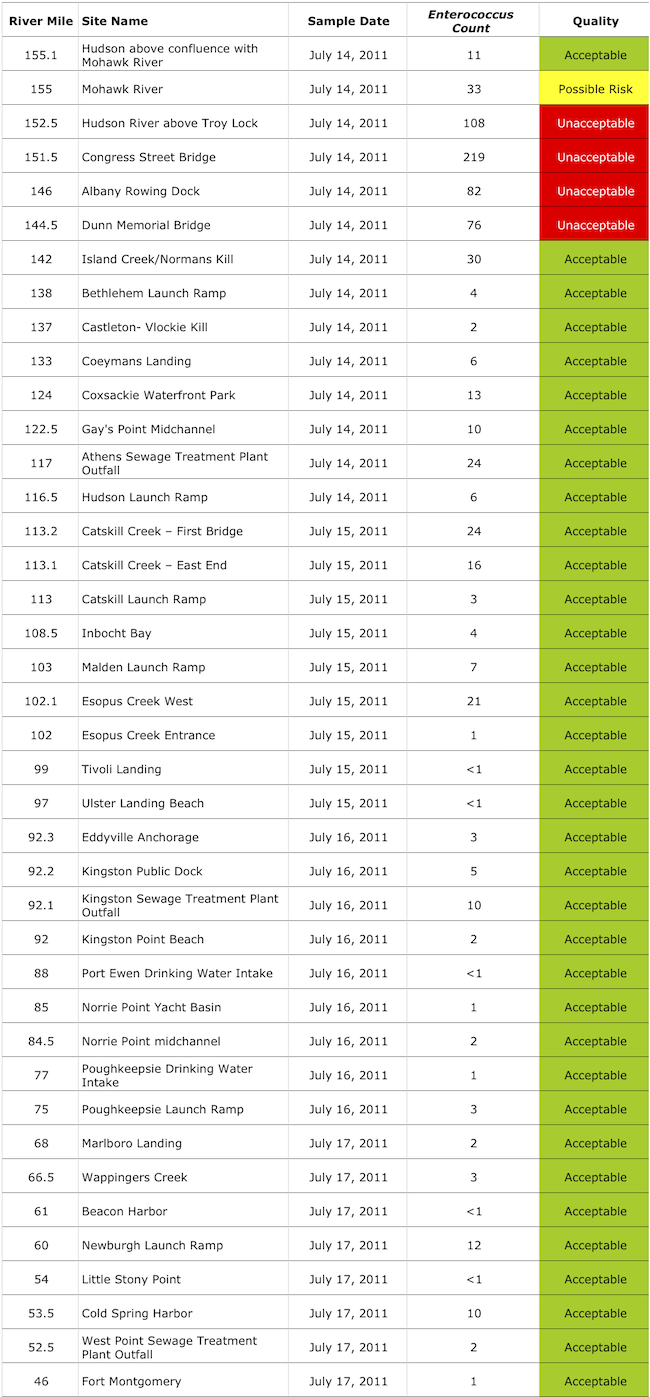
on Riverkeeper’s website. Catskill to Waterford (day 6): Regional rain records indicate that there was more rain at the northern end of the Estuary earlier this week than we saw farther south (1.0” two days prior to sampling and 1.1” three days prior to sampling). Both Hudson and Athens stations were “Unacceptable,” but only by small margins. Then we saw lower counts until we reached Albany. The Station at the Dunn Memorial Bridge was “Unacceptable” again, by a relatively small margin (this station is near one of the Capitol District’s largest CSOs and about 50% of our samples at this location are “Unacceptable”). The headwaters of the Hudson and also the Mohawk were “Acceptable” in June. July Observations Waterford to Hudson/Athens (day 1): There was a brief heavy downpour the day before in the afternoon (30 minutes) which may explain the “Possible Risk” reading in the Mohawk and an “Unacceptable” reading just above Troy Lock. About 47% of our samples are “Unacceptable” at this station. There is a CSO just above the lock and the lock keepers have complained about toilet paper and other floatables in the water. There was a family planning item in the lock as we descended to the Hudson. But then we found a whopper of a CSO discharging hard right by the Congress Street Bridge in Watervliet, across from Troy. The discharge was blood red, which I haven’t seen before. We sampled the discharge and reported to NYS DEC Region 4. DEC’s response was fast and effective; see report summary and photos here. The Entero count of the discharge water was 17,329 cells per 100/ml (the Federal guideline for swimming is 61 per 100/ml,) so it’s no surprise that our regular sampling stations downstream of this unpermitted discharge were also “Unacceptable.” As we traveled south the counts diminished and finally became “Acceptable” again after mixing and dilution worked their magic. This case is particularly interesting as the cities forming the Capitol District (Albany, Troy, Rensselaer, Watervliet, Cohoes and the Village of Green Island) have just finished a multi-year, multi-million dollar survey to determine a long-term control plan for CSOs. But the way NY State water quality standards are written mandates looking at monthly averages of water quality data instead of single sample data (like ours). The New York State standard minimizes the impact of short lived but violently contaminated sewage discharges from CSOs (which was exactly the point of the Capital District study). So, because of the way the study was undertaken, the consultants have determined that CSOs are really not an issue and have recommended reducing CSO discharges by less than 25% while not really reducing the actual number of CSO pipes. Look at our sampling data below. You don’t have to be a Ph.D. to see that CSOs ACTUALLY MATTER!
Yonkers to Peekskill (day 5): Still no rain and again ALL sites/samples were “Acceptable.” Amazing what we see when there is no crap overflowing into the Hudson. NY Harbor (day 6): There was a short shower late yesterday afternoon but almost all sites remained “Acceptable.” Our station near the CSO at the public pier at 125th Street was “Unacceptable” as was the sample site at the entrance of Gowanus Canal. At 1046 cells per 100/ml this was the worst station in the entire survey (except for that discharge in Watervliet at the other end.) But then again, the water in the Gowanus is pretty nasty. Until next month, Together with our science partners from Lamont-Doherty Earth Observatory and Queens College, Riverkeeper samples for Enterococcus (an indicator of untreated sewage) at our 74 standard sampling locations from May through October. If you
received this email from a friend and would like to be added to our
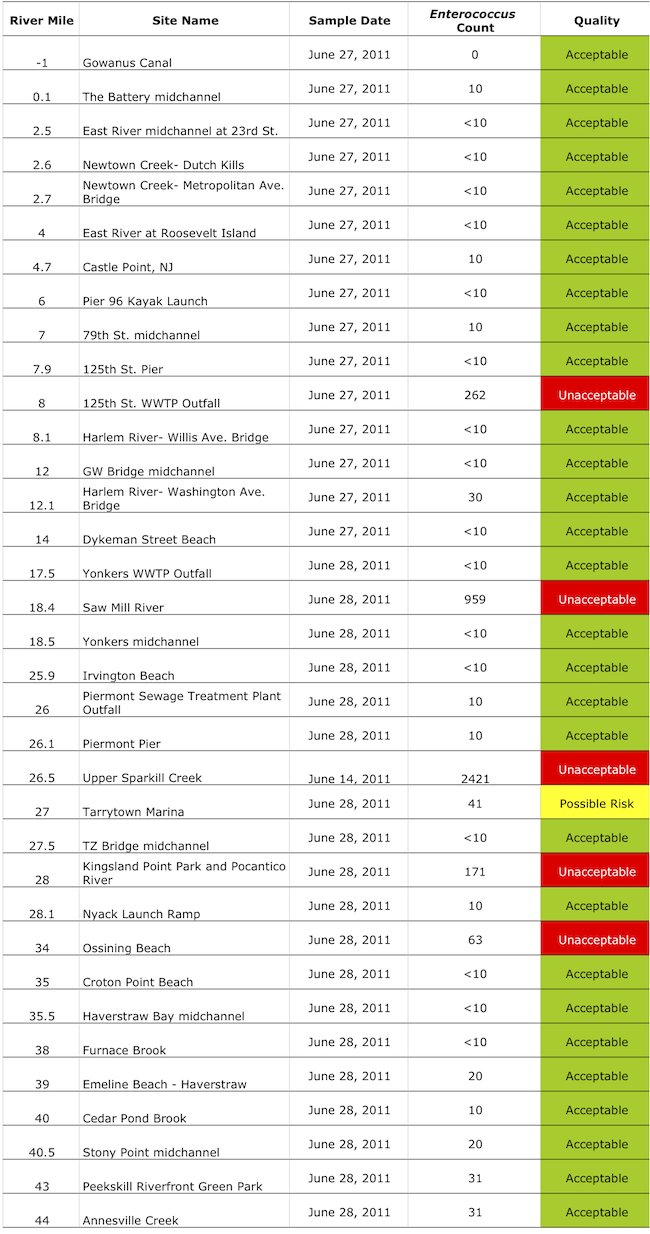
Water Quality email list, send your contact information to us at info1@riverkeeper.org. June 2011 Sampling Data For
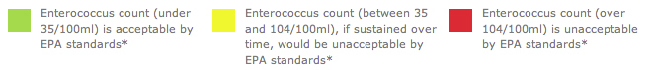
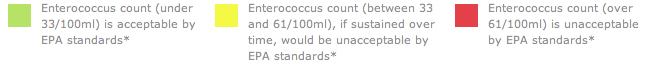
River Mile 0 to River Mile 44, the following standards apply:
For River Mile 45 north, the following standards apply:
July 2011 Sampling Data For River Mile 155 to River Mile 46, the following standards apply:
For
River Mile 45 south, the following standards apply: To learn more about Riverkeeper’s Water Quality Program, and to view historic sampling data, please visit www.riverkeeper.org/water-quality/hudson. View sampling data sorted historically by individual sampling location. View archived monthly water quality reports from May 2010 to the present. © Riverkeeper 2011 |
|
|
|---|
|
|
|
|